



Instagram earned $32.4 billion in advertising revenue in 2021, almost triple its $11.3 billion in 2018, according to figures Meta disclosed in a 2024 court filing. Those are the last full-year Instagram-only figures Meta has ever released. Since then, Meta’s total advertising revenue has kept growing fast, reaching $196.2 billion in 2025 and $63.1 billion in the third quarter of 2026 alone.
This report covers Instagram’s revenue history, Meta’s advertising results for 2025 and 2026, Instagram revenue in the United States, the factors behind its growth, and the main analyst forecasts. It draws on Meta’s quarterly earnings releases, its Form 10-Q filing, its Q3 2026 earnings call, Meta’s court filing in the FTC antitrust case, and eMarketer forecasts. Please find details of the sources in our methodology section at the bottom of this content.
Our original analysis separates official figures from estimates, calculates Instagram’s growing share of Meta’s ad business, and explains why it is unwise to estimate today’s Instagram revenue from older data.
Key Instagram Revenue Statistics 2026
- Meta earned $63.1 billion in ad revenue in Q3 2026, up 26% year over year.
- Meta’s average price per ad rose 14% year over year in Q3 2026, while ad impressions grew 10%.
- Meta made $196.2 billion in ad revenue in 2025 across Facebook, Instagram, Messenger, and WhatsApp, up 22% from 2024.
- eMarketer predicted that Instagram would bring in 50.3% of Meta’s US ad revenue in 2025, crossing half for the first time (December 2024 forecast).
- Instagram reaches 3 billion people every month, Mark Zuckerberg said in September 2025.
- Instagram earned $16.5 billion in ad revenue in the first half of 2022. That’s the most recent Instagram-only figure Meta has shared.
- Instagram made $32.4 billion in ad revenue in 2021, which was 28.2% of Meta’s total. Meta hasn’t shared a full-year Instagram figure since then.
How Much Revenue Does Instagram Make?
Instagram makes nearly all of its money from advertising. Meta does not report Instagram as a separate business, so the only official Instagram-only revenue figures come from a Meta court filing covering 2018 to mid-2022.
Instagram Ad Revenue by Year
- $11.3 billion in ad revenue was generated by Instagram in 2018.
- $17.9 billion in 2019, up 58% from 2018.
- $22.0 billion in 2020, up 23% from 2019.
- $32.4 billion in 2021, up 47% from 2020.
- $16.5 billion in the first half of 2022.
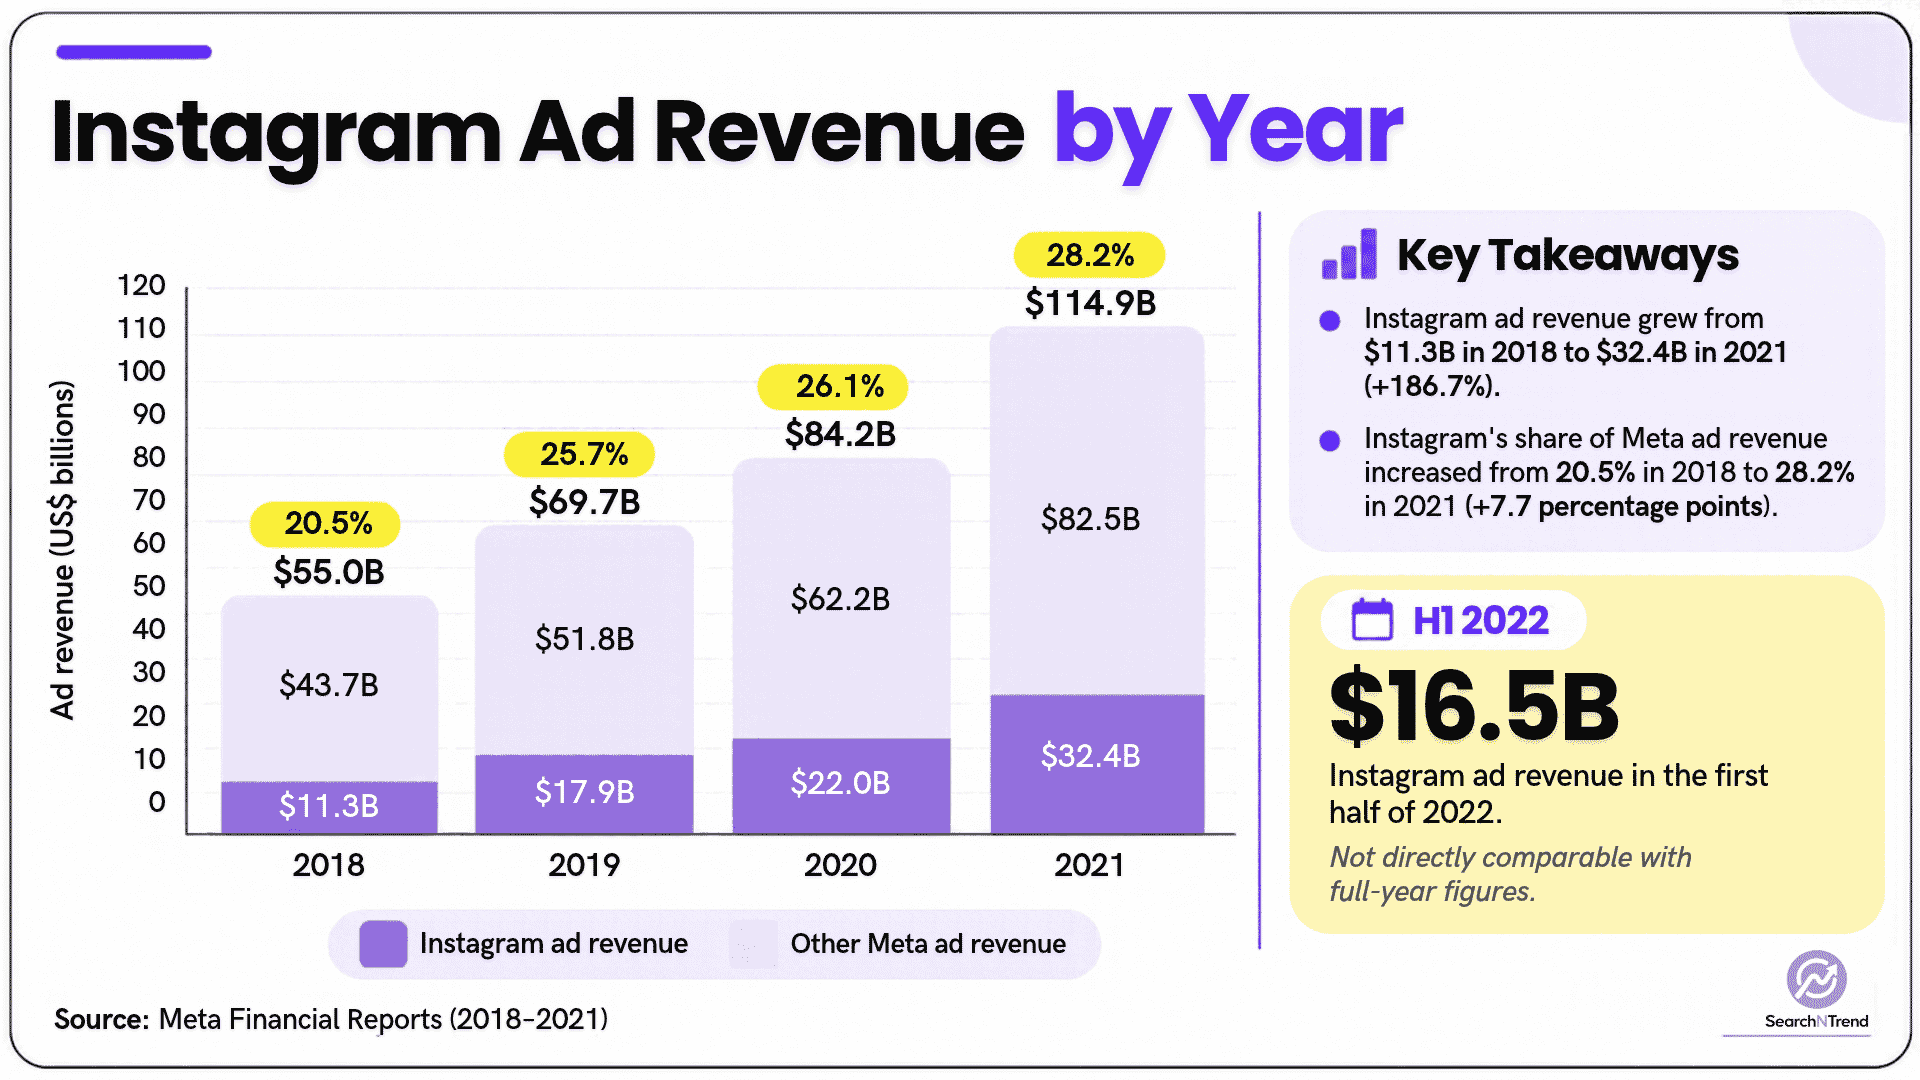
The table below shows a detailed breakdown of Instagram Ad revenue by year:
| Year | Instagram ad revenue | Meta ad revenue | Instagram share of Meta ad revenue |
|---|---|---|---|
| 2018 | $11.3B | $55.0B | 20.5% |
| 2019 | $17.9B | $69.7B | 25.7% |
| 2020 | $22.0B | $84.2B | 26.1% |
| 2021 | $32.4B | $114.9B | 28.2% |
| H1 2022 | $16.5B | Not comparable | Not available |
Sources: Meta, Meta earnings releases (2019, 2021)
Why Meta Does Not Report Instagram Revenue Separately
Meta reports two segments: Family of Apps and Reality Labs. Family of Apps combines Facebook, Instagram, Messenger, WhatsApp, and other services, and Meta’s earnings releases and SEC filings give no revenue split by app. The Instagram figures above became public only because Meta used them in its April 2024 motion for summary judgment in the FTC antitrust case. On November 18, 2025, a federal judge ruled that the FTC had not shown Meta holds a monopoly, so Meta keeps Instagram.
Sources: Meta Q3 2026 earnings release, NPR
The $20 Billion Figure in Older Reports
Many older roundups say Instagram made $20 billion in 2019. That figure came from a February 2020 Bloomberg report citing anonymous people familiar with the matter. Meta’s later court filing put Instagram’s 2019 ad revenue at $17.9 billion, so the widely repeated figure was about 12% too high.
Meta Advertising Revenue in 2025 and 2026
Because Instagram is not reported separately, Meta’s Family of Apps advertising revenue is the closest official measure of the business Instagram belongs to. Almost all of Meta’s revenue comes from these ads.
Annual Family of Apps Ad Revenue
- $196.2 billion in advertising revenue was reported by Meta in 2025, up 22% from $160.6 billion in 2024.
- $201.0 billion in total revenue was reported by Meta in 2025, meaning ads made up 97.6% of the total.
- 12% was the growth in ad impressions in 2025, while the average price per ad rose 9%.
- $177.4 billion in advertising revenue was reported by Meta in the first nine months of 2026, up 28.6% from $138.0 billion a year earlier.
Sources: Meta (FY2025 release, Q3 2026 Form 10-Q)
Instagram Quarterly Ad Revenue Growth in 2026
- $55.0 billion in ad revenue in Q1 2026, up 33% year over year.
- $59.4 billion in Q2 2026, up 27%.
- $63.1 billion in Q3 2026, up 26%.
- $73 billion to $76 billion is Meta’s guidance for total Q4 2026 revenue.
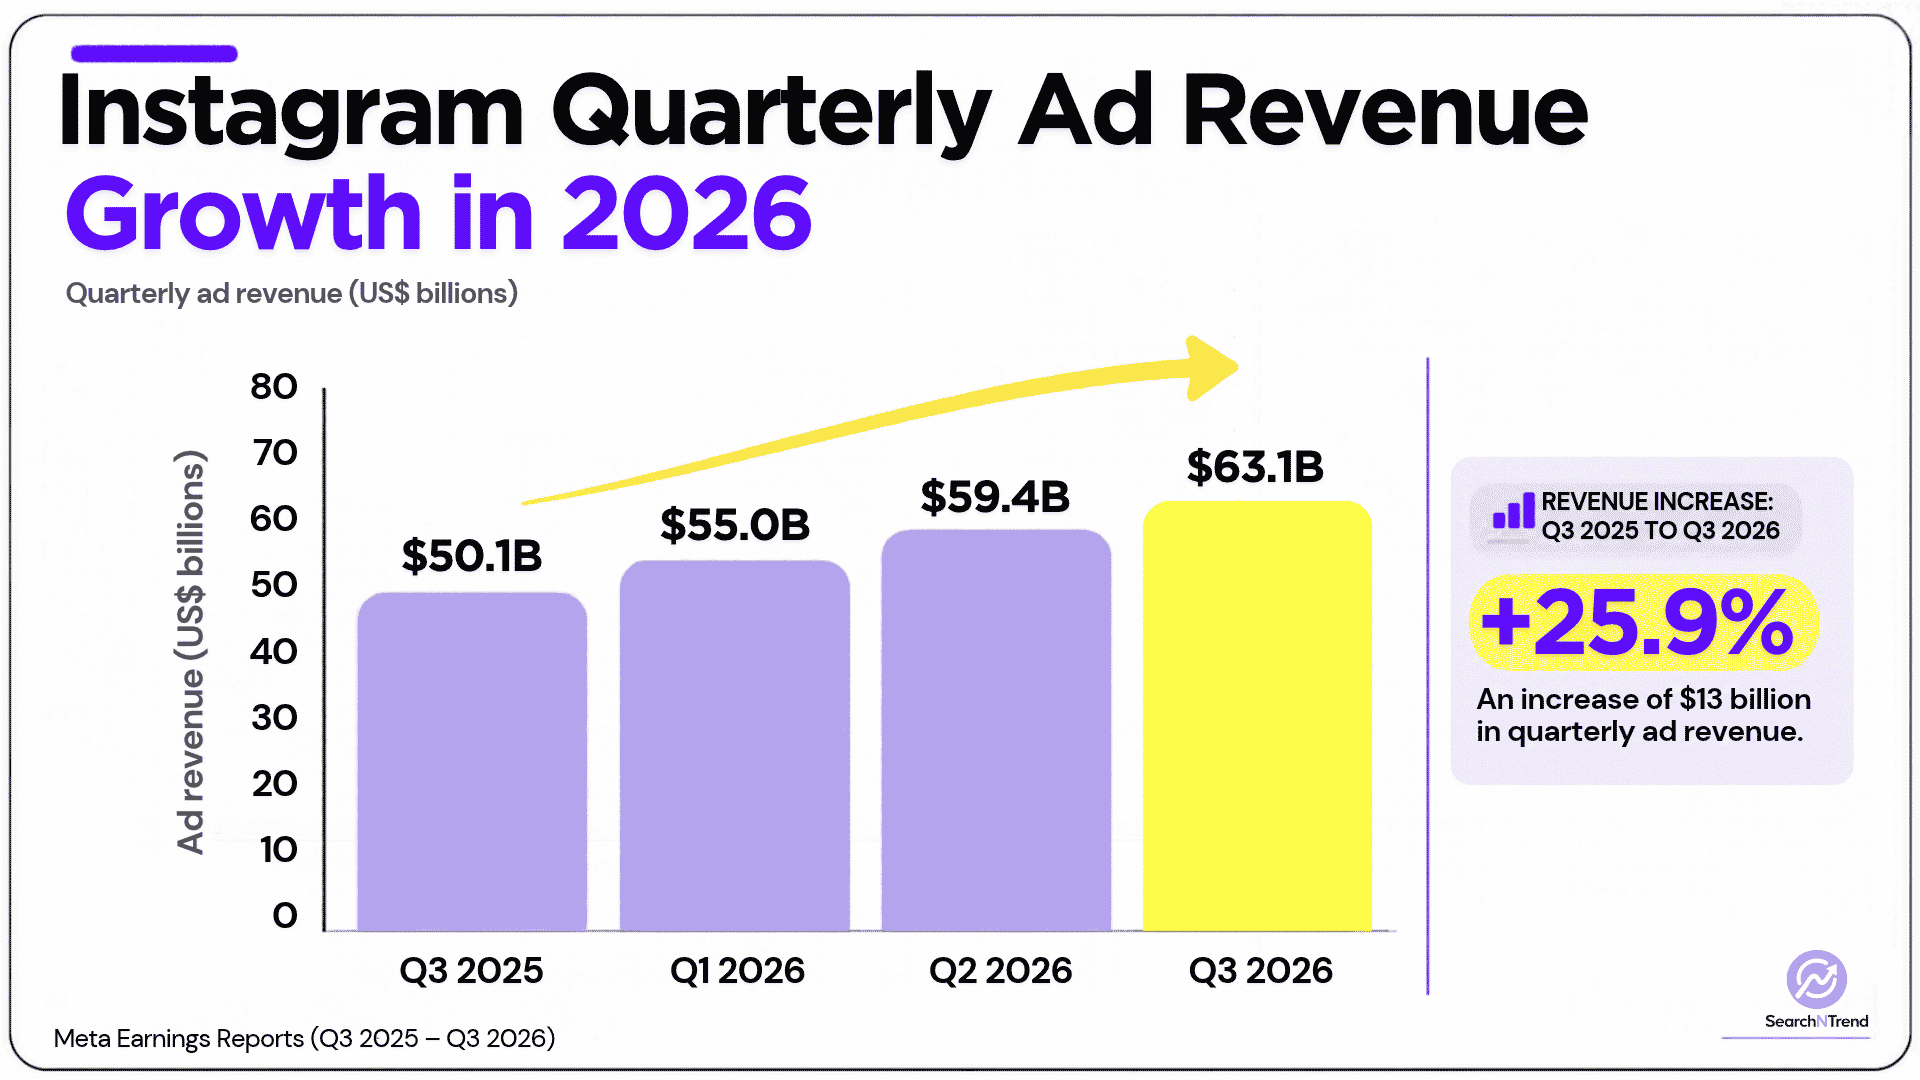
The table below shows a detailed breakdown of Instagram’s ad revenue by quarter in 2026:
| Quarter | Ad revenue | Year-over-year growth | Ad impressions growth | Average price per ad growth |
|---|---|---|---|---|
| Q3 2025 | $50.1B | 26% | 14% | 10% |
| Q1 2026 | $55.0B | 33% | 19% | 12% |
| Q2 2026 | $59.4B | 27% | 14% | 12% |
| Q3 2026 | $63.1B | 26% | 10% | 14% |
Sources: Meta earnings releases (Q3 2025, Q1 2026, Q2 2026, Q3 2026)
Instagram Revenue in the United States
The United States is Instagram’s most valuable market. Meta does not publish US revenue by app, so US Instagram figures are analyst forecasts, while Meta’s own geographic data covers the US and Canada together.
Instagram’s Share of Meta US Ad Revenue
- $32.03 billion in US ad revenue was forecast for Instagram in 2025, up 24.4% from 2024 (eMarketer, December 2024).
- 50.3% of Meta’s US ad revenue was forecast to come from Instagram in 2025, up from 7.7% in 2015.
- $223 in US ad revenue per Instagram user was forecast for 2025, compared with $191 per Facebook user.
Sources: eMarketer
US and Canada Revenue Growth
- $26.2 billion in revenue came from US and Canada customers in Q3 2026, up 33.0% from $19.7 billion in Q3 2025.
- 40.6% of Meta’s Q3 2026 revenue came from US and Canada customers.
- $71.3 billion in revenue came from US and Canada customers in the first nine months of 2026, up 29.6%.
The table below shows Meta’s Revenue by region:
| Region | Q3 2026 revenue | Q3 2025 revenue | Growth |
|---|---|---|---|
| US and Canada | $26.2B | $19.7B | 33.0% |
| Europe | $14.0B | $11.6B | 21.2% |
| Asia-Pacific | $17.0B | $14.3B | 18.8% |
| Rest of World | $7.4B | $5.7B | 30.1% |
| Total | $64.6B | $51.2B | 26.1% |
Source: Meta Form 10-Q, SearchNTrend calculations (growth)
These figures cover all Meta revenue by customer billing address, not Instagram alone or where ad viewers live.
Sources: Meta Q3 2026 Form 10-Q
What Drives Instagram’s Revenue Growth
Ad revenue grows when platforms show more ads, charge more per ad, or both. In 2026, Meta’s growth has shifted toward higher prices, helped by AI ad ranking, while Instagram engagement keeps rising.
Ad Prices and Impressions
- 14% was the rise in Meta’s average price per ad in Q3 2026, the fastest in the past four reported quarters.
- 10% was the growth in ad impressions in Q3 2026, down from 19% in Q1 2026.
- 9.6% more app ad conversions came from Meta’s GEM ads ranking model in Q3 2026, along with a 1.7% increase in offsite conversions.
- Nearly 10 million advertisers used at least one of Meta’s generative AI ad creative tools (Q3 2026).
Sources: Meta (Q3 2026 earnings release, Q3 2026 earnings call)
Reels and Video Engagement
- Over $50 billion was the annual revenue run rate of Reels across Facebook and Instagram combined, according to Mark Zuckerberg (Q3 2025).
- Nearly 45% of recommended Instagram Reels were less than a day old in Q3 2026, up more than 11 percentage points from Q2.
- Over 4% more Reels time spent came from Meta’s Q3 2026 relevance improvements.
- Over $15 billion was the annual revenue run rate of Partnership Ads, which pair brand and creator content, up 97% year over year (Q3 2026, Meta-wide).
Sources: Tubefilter, Meta Q3 2026 earnings call
Instagram Users and Time Spent
- Meta announced 3 billion monthly active users for Instagram on September 24, 2025.
- Instagram’s global time spent per user grew double digits year over year in Q3 2026 to an all-time high, with strength in both Reels and Feed.
- 3.64 billion people used at least one Meta app each day on average in September 2026, up 3% year over year.
Sources: Mobile Ecosystem Forum, Meta (Q3 2026 earnings call, Q3 2026 earnings release)
Instagram Revenue Forecasts
Analyst forecasts fill the gap left by Meta’s reporting. They are estimates, not reported results, and eMarketer has revised its Instagram figures across forecast editions.
- $32.03 billion in US Instagram ad revenue was forecast for 2025 (eMarketer, December 2024).
- By eMarketer’s estimate, 53.7% of Instagram’s worldwide ad revenue came from Feed ads and 24.6% from Stories in 2024. Explore, Reels, and potentially Threads were forecast to make up 9.6% in 2025.
- $243.46 billion in worldwide ad revenue is forecast for Meta in 2026, up 24.1%, putting Meta ahead of Google ($239.54 billion) for the first time (eMarketer, April 2026).
Sources: eMarketer (December 2024 forecast), Marketing Dive
Analysis on Instagram Revenue By SearchNTrend
We used Meta’s own figures to test what can and cannot be said about Instagram’s revenue today.
Instagram Grew Faster Than Meta Before Disclosures Stopped
Between 2018 and 2021, Instagram’s ad revenue grew from $11.3 billion to $32.4 billion, a compound annual growth rate of 42.1%. Meta’s total ad revenue grew from $55.0 billion to $114.9 billion over the same period, a 27.8% annual rate. As a result, Instagram’s share of Meta’s ad revenue rose from 20.5% to 28.2% in three years. Calculation: $32.4B / 114.9B=28.2%;(32.4B / $11.3B)^(1/3) – 1 = 42.1%.
No Official Instagram Revenue Figure Exists After Mid-2022
The most recent Instagram-only figure is $16.5 billion for the first half of 2022. Every Instagram figure for 2023 to 2026 is an estimate. Many roundups present eMarketer forecasts, such as Instagram passing Facebook in US ad revenue, as reported facts. Meta has not confirmed any of them.
Why the 2021 Share Cannot Estimate Today’s Revenue
Applying Instagram’s 2021 share (28.2%) to Meta’s 2025 ad revenue ($196.2 billion) would give about $55 billion. We do not treat that as an estimate. Meta’s ad revenue grew 70.7% between 2021 and 2025, and the mix has changed since then with Reels monetization, ads on Threads, and WhatsApp business messaging. Instagram’s share could be well above or below its 2021 level, and no public data settles it.
Price, Not Volume, Is Driving 2026 Growth
In Q1 2026, impressions grew 19% and price per ad grew 12%. By Q3 2026, impressions growth had slowed to 10% while price per ad grew 14%. The two multiply to the reported growth rate: 1.10 x 1.14 = 1.254, or about 25% to 26%. Meta now earns more per ad rather than mainly showing more ads, which is consistent with its reports of better ad conversions.
North America Is Outgrowing the Rest of the World
US and Canada revenue grew 33.0% in Q3 2026, compared with 26.1% for Meta overall, 21.2% in Europe, and 18.8% in Asia-Pacific. Because eMarketer forecasts Instagram to be Meta’s largest US ad business, faster growth in North America is relevant to Instagram, though Meta’s data cannot show the Instagram portion.
Methodology
This report separates four types of evidence: official Meta financial results (all apps combined), Instagram-only figures Meta disclosed in court, news reports based on anonymous sources, and analyst forecasts.
- Meta earnings releases: Quarterly and annual results for 2018 to 2021, 2025, and Q1 to Q3 2026. Family of Apps advertising revenue covers Facebook, Instagram, Messenger, and WhatsApp combined.
- Meta Form 10-Q: Quarter ended September 30, 2026. Revenue by geography is based on customer billing addresses.
- Meta Q3 2026 earnings call: October 21, 2026. Source of Instagram engagement and ad product statements.
- Meta court filing: Motion for summary judgment in FTC v. Meta, April 2024. Instagram ad revenue for 2018 to H1 2022, as quoted by PYMNTS and Social Media Today.
- eMarketer: Forecasts published December 18, 2024 (Instagram) and April 2026 (Meta and Google, via Marketing Dive). These are model-based estimates.
- Bloomberg: February 4, 2020, based on anonymous sources. Cited only to explain an outdated figure.
Meta does not report revenue by app, so no official Instagram revenue exists after the first half of 2022. Meta’s geographic revenue reflects customer billing addresses, not user locations, and includes all apps. eMarketer publishes several forecast editions that do not always agree, and its full data is paywalled, so we cite only its dated public forecast. Reels run-rate and Partnership Ads figures cover Facebook and Instagram together. The Instagram 3 billion user milestone is cited from news coverage of Zuckerberg’s announcement. SearchNTrend calculations use rounded billions where shown.
Conclusion
Instagram’s last disclosed results show a business that nearly tripled in three years, reaching $32.4 billion in ad revenue in 2021 and 28.2% of Meta’s ad sales. Meta has not reported Instagram on its own since then, but the wider ad business keeps growing: $196.2 billion in 2025 and $63.1 billion in Q3 2026, driven increasingly by higher ad prices and strong growth in the US and Canada.
For marketers, journalists, and analysts, the key point is that any current Instagram revenue figure is an estimate and should be labeled that way. Three things are worth watching: whether Meta’s Q4 2026 revenue lands within its $73 billion to $76 billion guidance, whether price per ad keeps outpacing impressions, and whether Meta ever discloses app-level revenue again in a filing or court case.
FAQs
The latest official full-year figure is $32.4 billion in advertising revenue in 2021, disclosed by Meta in a 2024 court filing. Instagram also earned $16.5 billion in the first half of 2022. Figures for later years are analyst estimates.
No. Meta reports revenue for its Family of Apps segment, which combines Facebook, Instagram, Messenger, and WhatsApp. Instagram-only figures have only appeared in a court filing.
In 2021, Instagram generated 28.2% of Meta’s ad revenue, based on Meta’s own figures. eMarketer forecast that Instagram would account for 50.3% of Meta’s US ad revenue in 2025.
eMarketer forecasts $32.03 billion in US Instagram ad revenue for 2025. Meta does not publish an official US figure for Instagram.
Instagram mostly makes money through advertising in the Feed, Stories, Reels, and Explore. Meta’s growth in 2026 has come from both more ad impressions and higher prices per ad, with prices rising 14% in Q3 2026.