



Instagram algorithms prioritize meaningful interactions over simple profile growth. For brands, content creators, and marketing leaders, measuring success requires evaluating how effectively content triggers action from viewers. While follower counts were historically used to gauge social influence, tracking your Instagram engagement rate has become the ultimate performance metric for content resonance, audience trust, and algorithmic visibility.
Calculating your engagement rate allows businesses to benchmark performance against industry competitors, audit content effectiveness, and justify marketing investments. Social media algorithms reward posts that generate rapid interaction by expanding their reach across Explore pages and Reels feeds. This comprehensive performance report breaks down current engagement benchmarks by industry sector, post format, and account size, providing clear calculations and actionable tactics to improve Instagram engagement.
Instagram Engagement Benchmark at a Glance
The median follower-based Instagram engagement benchmark across all industries ranges between 0.35% and 0.50% per post. However, measuring engagement against reach or impressions yields significantly higher percentages, as reach-based calculations isolate active post viewers rather than total account followers.
- Platform-Wide Median: Standard follower-based engagement averages 0.36% across general brand profiles.
- Top 25% Performance Tier: High-performing profiles achieve follower-based engagement rates of 1.02% or higher.
- Format Winner: Instagram Reels engagement and Instagram Carousel engagement generate the highest overall interaction rates and algorithmic distribution.
- Account Size Dynamics: Smaller micro-accounts (under 10,000 followers) maintain higher average engagement rates compared to macro-tier profiles.
| Evaluation Metric | Average Instagram Engagement Rate | Top-Tier Performance (Top 25%) | Primary Metric Focus |
|---|---|---|---|
| Follower-Based Engagement Rate | 0.35% to 0.50% | 1.02% to 2.10% | Total Interactions / Total Followers |
| Reach-Based Engagement Rate | 3.20% to 4.50% | 7.50% to 12.00% | Total Interactions / Unique Accounts Reached |
| Impression-Based Engagement Rate | 1.80% to 3.00% | 5.00% to 8.50% | Total Interactions / Total Content Views |
| Median Monthly Posting Cadence | 17 Posts / Month | 22+ Posts / Month | Multi-Format Consistency |
How to Calculate Instagram Engagement Rate
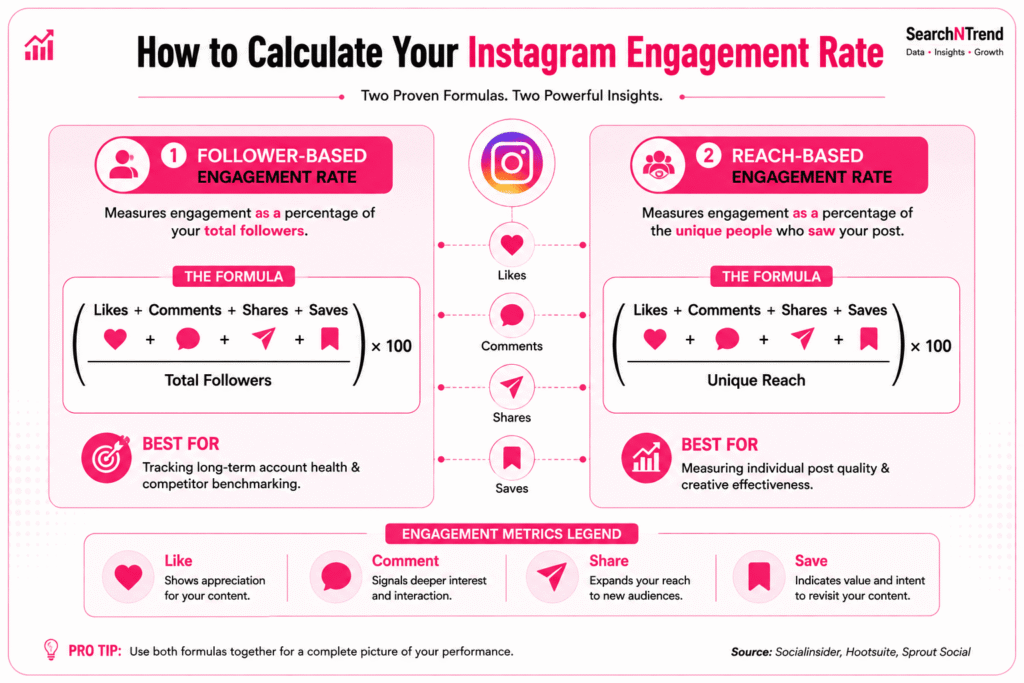
Understanding how to calculate Instagram engagement rate accurately depends on whether you are evaluating overall profile health or analyzing specific campaign creative performance.
Instagram Engagement Rate Formula Options
Choosing the right Instagram engagement rate formula helps isolate specific performance variables.
Key Interactions Measured in the Formulas
- Likes: Low-friction validation indicating visual approval.
- Comments: Signals strong conversational interest and algorithmically boosts post distribution velocity.
- Shares: High-value metric that expands content directly into private Direct Message (DM) feeds.
- Saves: Bookmarking action indicating utility, educational value, and long-term relevance.
What is a Good Instagram Engagement Rate in 2026?
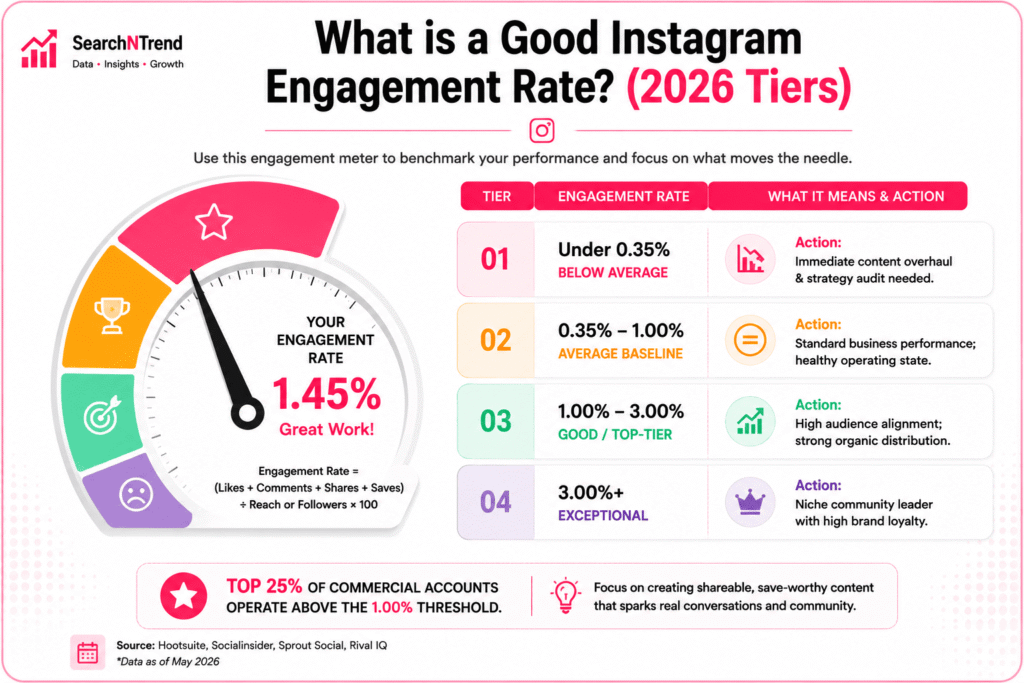
Determining a good Instagram engagement rate requires comparing your metrics against platform-wide performance tiers.
| Engagement Rate Range | Performance Classification | Status & Action Plan |
|---|---|---|
| Under 0.35% | Below Platform Average | Requires an immediate strategy audit and creative content overhaul |
| 0.35% – 1.00% | Average Instagram Engagement Rate | Represents standard, healthy baseline brand performance |
| 1.00% – 3.00% | Good Instagram Engagement Rate | High-performing accounts with strong audience alignment |
| 3.00%+ | Exceptional Benchmark | Niche or community leader with outstanding profile loyalty |
Analyzing the Engagement Performance Tiers
- Below 0.35% (Below Average): Accounts experience minimal interaction. Posts rarely appear on Explore feeds, signaling a need to increase Instagram engagement through new post formats.
- 0.35% – 1.00% (Average Tier): Represents the typical baseline for business accounts. Interactions are steady, though algorithmic reach remains controlled.
- 1.00% – 3.00% (Good/Top-Tier): Accounts in this bracket rank in the top quartile. Content consistently generates saves and shares, pulling in organic followers without heavy ad reliance.
- 3.00%+ (Exceptional Tier): Achieved primarily by niche micro-influencers, sports teams, and fan communities with high emotional resonance and high comment velocity.
Instagram Engagement Benchmark by Industry
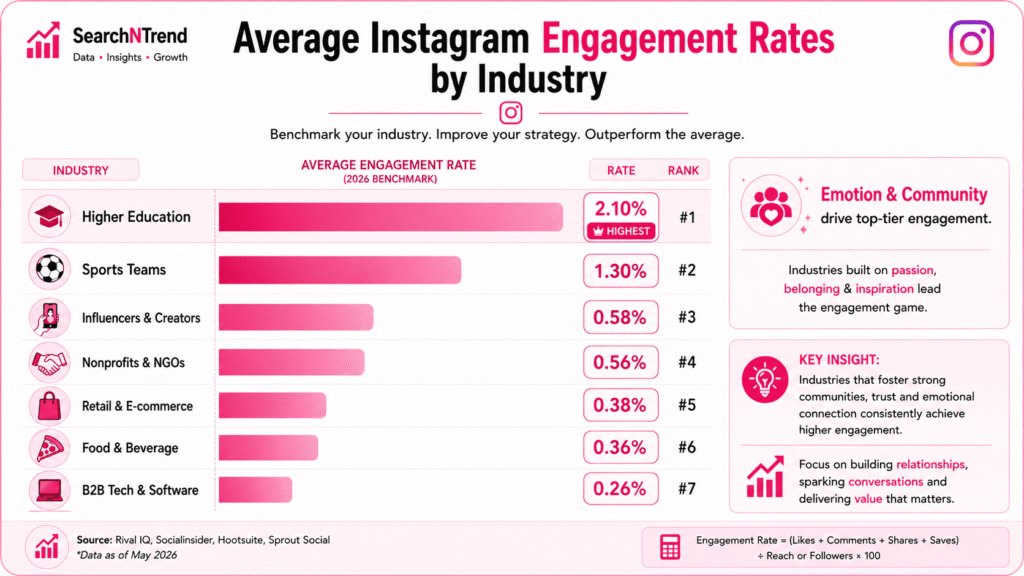
Engagement levels fluctuate depending on audience passion, industry visuals, and posting volume.
| Industry Sector | Median Follower Engagement Rate | Average Weekly Posting Cadence | Primary Content Driver |
|---|---|---|---|
| Higher Education | 2.10% | 4.1 Posts / Week | Student culture, campus pride, user-generated content |
| Sports Teams | 1.30% | 19.8 Posts / Week | Real-time game highlights, behind-the-scenes video |
| Nonprofits & NGO | 0.56% | 4.2 Posts / Week | Mission impact stories, community activism |
| Influencers & Creators | 0.58% | 4.5 Posts / Week | Personal vlogs, lifestyle tutorials, aesthetic visuals |
| Retail & E-commerce | 0.38% | 5.2 Posts / Week | Product showcases, lifestyle integrations, promotions |
| Food & Beverage | 0.36% | 4.5 Posts / Week | Recipe videos, food imagery, promotional offers |
| B2B Tech & Software | 0.26% | 3.2 Posts / Week | Industry statistics, product tips, corporate culture |
Format Benchmarks: Instagram Reels Engagement vs. Carousel Engagement
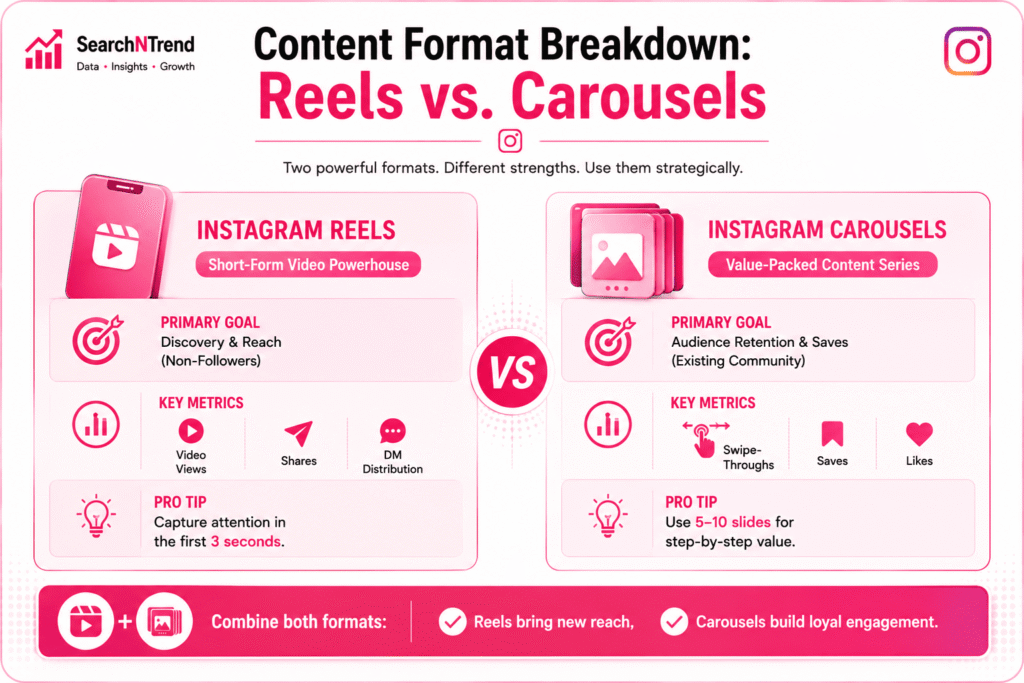
Publishing the right media format directly affects how the Instagram recommendation engine distributes your posts.
| Post Format | Primary Engagement Metric | Reach Multiplier Potential | Best Content Strategy |
|---|---|---|---|
| Instagram Reels | Video Views, Shares, Direct Messages | High (Explores Non-Followers) | Short-form video, trending audio, hooks under 3s |
| Instagram Carousels | Swipe-Throughs, Saves, Likes | Medium-High (Multiple Feed Impressions) | Multi-slide tutorials, data infographics, step-by-step guides |
| Single Image Posts | Quick Likes, Direct Comments | Standard (Primarily Existing Followers) | High-resolution photography, quotes, quick announcements |
Maximizing Instagram Reels Engagement
Reels serve as the primary engine for attracting non-followers. While likes on Reels mirror standard photos, their share-to-DM velocity is significantly higher, encouraging the algorithm to serve video content across recommended feeds.
Maximizing Instagram Carousel Engagement
Carousels deliver the highest interaction rates among existing followers. If a follower scrolls past a carousel without engaging, Instagram frequently re-serves the same post later with the second slide featured, creating a secondary opportunity to capture a swipe, like, or save.
How to Improve Instagram Engagement: 7 Proven Tactics
If your profile falls below the platform baseline, implementing targeted content changes will help increase Instagram engagement effectively.
1. Optimize for Shares and Saves Over Likes
Shift content strategy toward producing shareable resources. Relatable memes, infographics, and actionable checklists drive direct messaging shares and post saves, sending strong quality signals to the algorithm.
2. Capitalize on Instagram Carousel Engagement Multipliers
Structure carousels with 5 to 10 slides that break down complex ideas step-by-step. Use a high-contrast visual hook on slide one, deliver concentrated value across middle slides, and end with an explicit call-to-action on the final slide.
3. Boost Instagram Reels Engagement with Early Hooks
Retention rate determines short-form video reach. Position visual movement or clear text hooks on screen within the first 3 seconds of your Reel to stop scrolling behavior and increase full video completion rates.
4. Leverage Interactive Story Stickers
Publish daily Instagram Stories utilizing native poll stickers, quiz blocks, and question boxes. Frequent story interactions increase overall profile velocity, helping push your feed posts higher in follower timelines.
5. Co-Create Content via Collaborative Posts
Use the Instagram Collab feature to author feed posts or Reels jointly with complementary accounts. Collab posts stream across both profile feeds simultaneously, combining engagement metrics and exposing your account to an established secondary audience.
6. Maintain a Balanced Posting Cadence
Avoid over-posting, which can cause audience fatigue and dilute reach per post. Maintain a consistent schedule of 3 to 5 well-crafted posts per week to keep audience interest high.
7. Drive Early Comment Velocity
Reply to comments within the first hour of publishing. Engaging in immediate conversations doubles total post comments and triggers algorithmic signals that promote higher feed placement.
Frequently Asked Questions (FAQs)
The platform-wide average Instagram engagement rate sits between 0.35% and 0.50% per post for standard business profiles across all account sizes.
Yes, a 1.00% engagement rate by followers is considered a good Instagram engagement rate, placing your profile in the top quartile of performance across most commercial sectors.
Instagram Carousel engagement generates the highest consistent interaction rates from existing followers, while Instagram Reels engagement drives the highest overall non-follower reach and video share volume.
To improve Instagram engagement quickly, transition away from static single-image posts toward 5-to-10 slide educational carousels, open Reels with 3-second visual hooks, and reply to all user comments immediately after posting.