




YouTube generated over $60 billion in total revenue in 2025 and is on track to reach $68.5 billion to $72 billion by the end of 2026. This revenue is driven by $40.36 billion in video advertising sales and $19.64 billion from paid subscriptions across its 325 million Premium, Music, and TV subscribers. As Alphabet’s second-largest revenue channel, YouTube accounts for nearly 15% of Google’s consolidated earnings and holds an estimated standalone market valuation of $550 billion.
This statistical report breaks down YouTube’s financial performance for 2026, analyzing historical growth trajectories, advertising splits, subscription adoption, creator payouts, and macroeconomic GDP impact.
Key Takeaways & Quick Highlights (2026)
- Total Revenue Milestone: YouTube’s total annual revenue crossed $60 billion in 2025 and is projected to reach $68.5 billion to $72 billion by the end of 2026 across ad sales and subscription services.
- Advertising Dominance: Advertising remains the primary revenue stream, contributing over $40.36 billion in 2025 and heading toward an estimated $45.5 billion in 2026.
- Quarterly Ad Performance: Q4 2025 marked the platform’s highest single-quarter ad revenue at $11.38 billion, accounting for 28.2% of the year’s total ad revenue.
- Subscription Growth: YouTube Premium, YouTube Music, and YouTube TV generated $19.64 billion in 2025. Total paid subscribers across Google’s ecosystem reached 325 million.
- Alphabet Revenue Share: YouTube advertising accounts for nearly 15% of Alphabet’s total consolidated revenues, serving as Google’s second-largest revenue generator behind Search.
- Estimated Platform Valuation: Financial analysts estimate YouTube’s standalone enterprise value at roughly $550 billion, representing roughly 30% of Alphabet’s total market valuation.
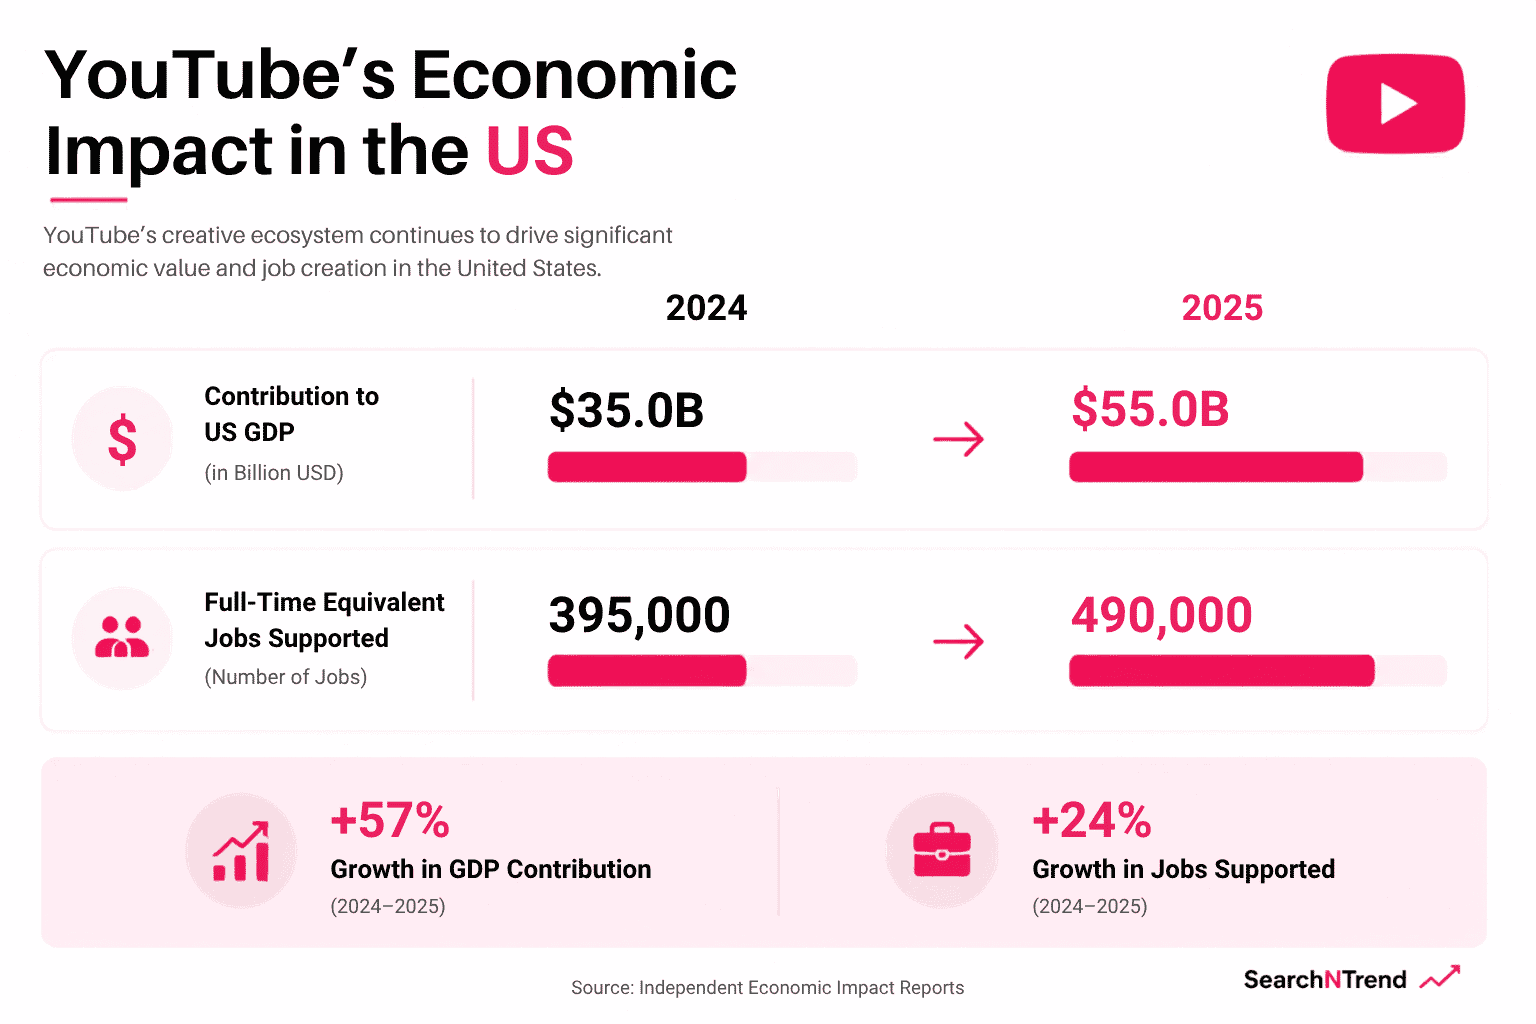
- Creator Ecosystem Impact: YouTube contributed over $55 billion to the U.S. GDP in 2025, supporting more than 490,000 full-time equivalent jobs.
- Payout Rates: Average creator pay ranges from $1.00 to $30.00 per 1,000 views, depending on niche, audience geography, and video format.
YouTube Revenue 2026 (Overview & Growth)
YouTube generates revenue primarily through two distinct business models: advertising services and premium subscription plans. In 2025, total combined revenue crossed the $60 billion threshold, reflecting an 11.8% year over year growth from the $54.2 billion recorded in 2024.
This sustained expansion is driven by accelerated demand for connected TV (CTV) ad inventory, the rapid monetization of YouTube Shorts, and steady conversion of free users into paid subscribers for YouTube Premium and YouTube TV.
YouTube Annual Revenue Growth Breakdown (Historical vs. Projected)
YouTube’s annual revenue went from $11.10 Billion in 2018 to now $60 billion as of 2025. Throughout the years, YouTube has seen significant growth.
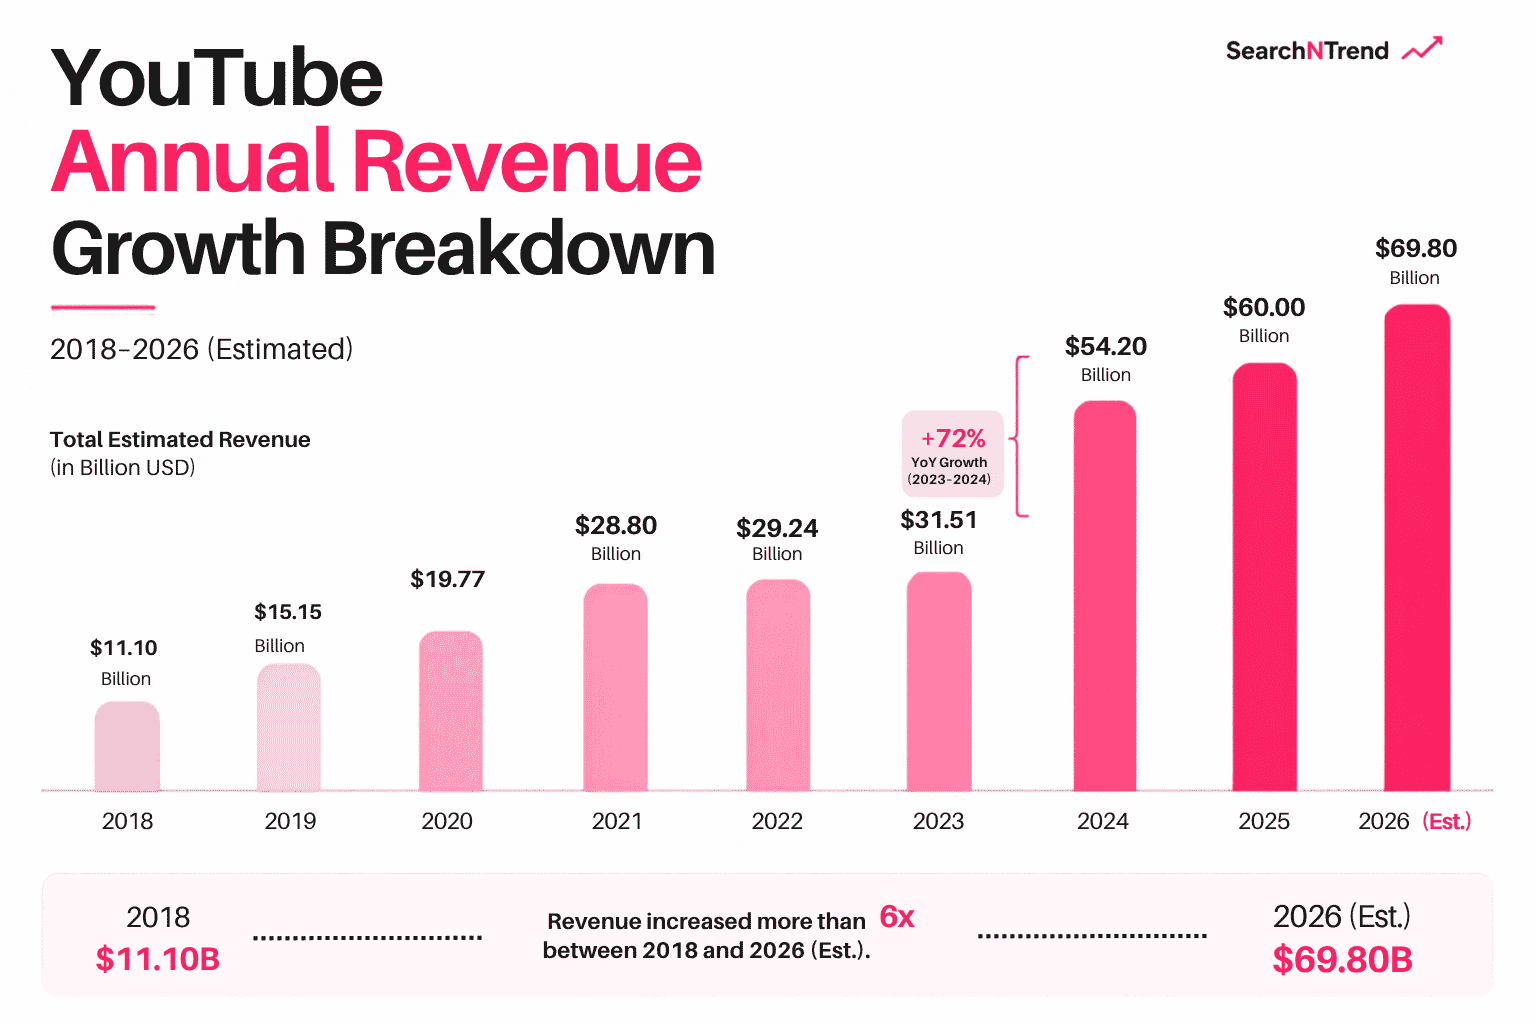
The following table details YouTube’s combined estimated total revenue from 2018 through 2026 projections, combining advertising and subscription earnings.
| Year | Total Estimated Reavenue | YoY Growth Rate | Primary Growth Driver |
|---|---|---|---|
| 2018 | $11.10 Billion | — | Desktop & Mobile Video Ads |
| 2019 | $15.15 Billion | 36.5% | Mobile App Usage Expansion |
| 2020 | $19.77 Billion | 30.5% | E-commerce & Pandemic Engagement |
| 2021 | $28.80 Billion | 45.7% | Post-Pandemic Ad Spend Recovery |
| 2022 | $29.24 Billion | 1.5% | Economic Headwinds & Ad Slowdown |
| 2023 | $31.51 Billion | 7.8% | Direct Response Ad Recovery |
| 2024 | $54.20 Billion | 72.0% | Subscription Integration & CTV |
| 2025 | $60.00 Billion | 10.7% | Premium Growth & Shorts Ads |
| 2026 (Est.) | $69.80 Billion | 16.3% | AI Ad Targeting & TV Expansion |
Quarter-by-Quarter YouTube Revenue Breakdown
Analyzing quarterly numbers reveals clear seasonal patterns. Revenue peaks significantly in the fourth quarter due to holiday retail ad campaigns and brand budget flushes.
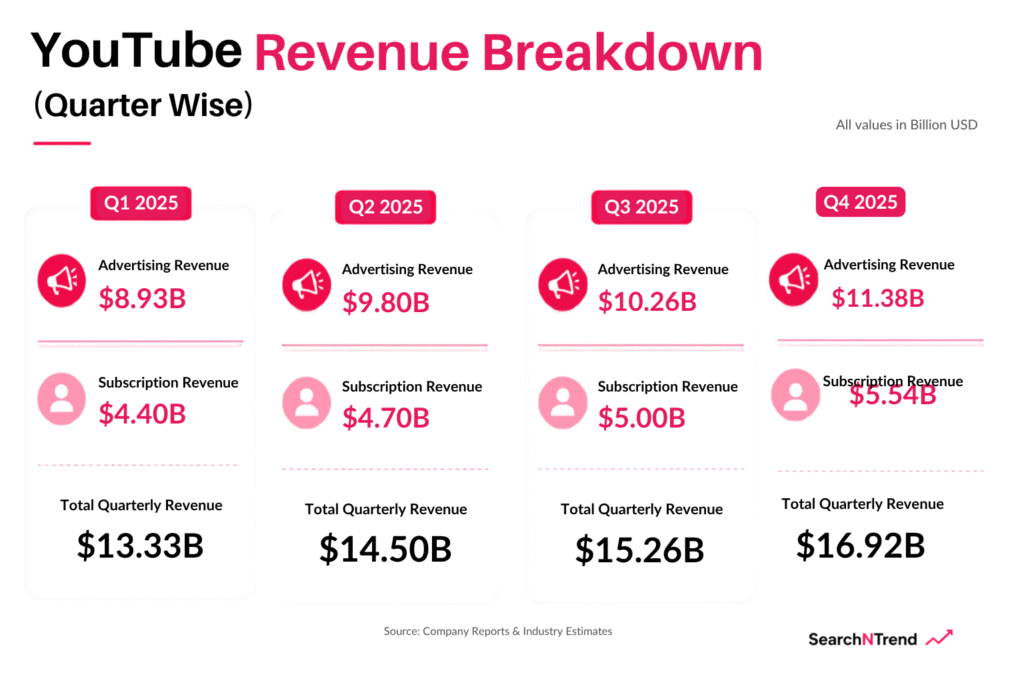
| Quarter (2025) | Advertising Revenue | Subscription Revenue (Est.) | Total Quarterly Revenue |
| Q1 2025 | $8.93 Billion | $4.40 Billion | $13.33 Billion |
| Q2 2025 | $9.80 Billion | $4.70 Billion | $14.50 Billion |
| Q3 2025 | $10.26 Billion | $5.00 Billion | $15.26 Billion |
| Q4 2025 | $11.38 Billion | $5.54 Billion | $16.92 Billion |
| Total 2025 | $40.37 Billion | $19.64 Billion | $60.01 Billion |
YouTube Advertising Revenue Statistics 2026
Advertising remains YouTube’s primary source of monetization. The platform offers multiple ad formats, including skippable and non-skippable video ads, display banners, overlay ads, and vertical video ads embedded within YouTube Shorts feeds.
YouTube Advertising Revenue Growth Over The Years
YouTube ad revenue grew from $0.8 billion in 2010 to over $40.36 billion in 2025. This multi-year surge illustrates the shift of marketing budgets from traditional broadcast television to online video platforms.
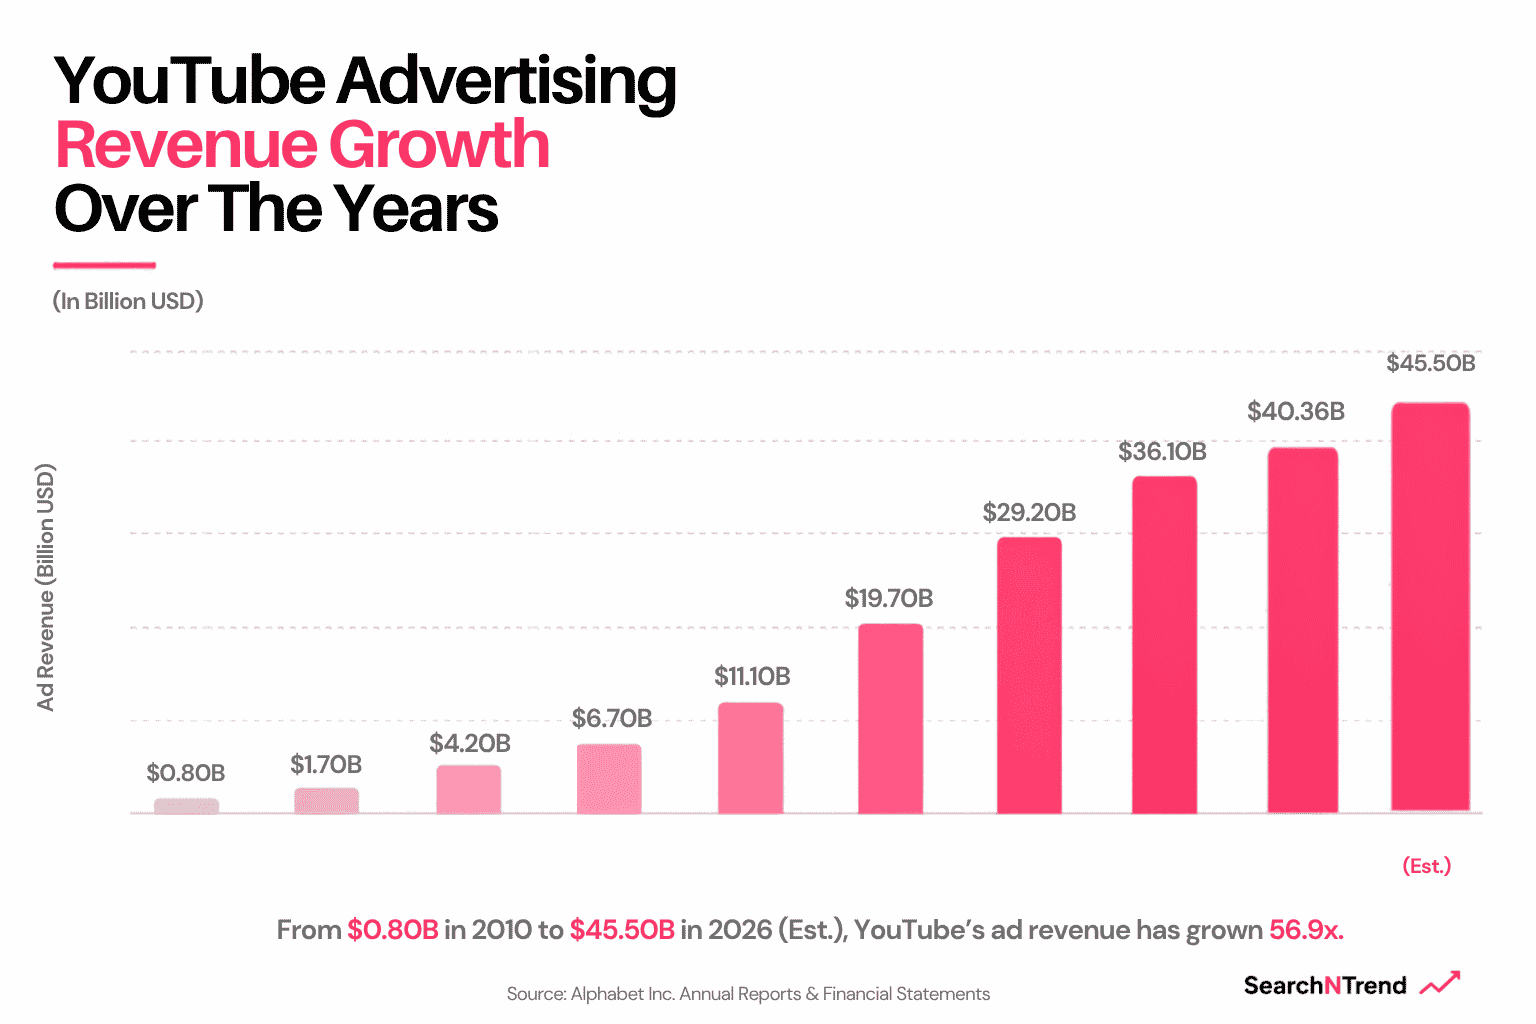
| Year | Ad Revenue | Net Increase |
| 2010 | $0.80 Billion | Baseline |
| 2012 | $1.70 Billion | +$0.90 Billion |
| 2014 | $4.20 Billion | +$2.50 Billion |
| 2016 | $6.70 Billion | +$2.50 Billion |
| 2018 | $11.10 Billion | +$4.40 Billion |
| 2020 | $19.70 Billion | +$8.60 Billion |
| 2022 | $29.20 Billion | +$9.50 Billion |
| 2024 | $36.10 Billion | +$6.90 Billion |
| 2025 | $40.36 Billion | +$4.26 Billion |
| 2026 (Est.) | $45.50 Billion | +$5.14 Billion |
YouTube Quarterly Ad Revenue Performance in 2025
Quarterly ad revenue data demonstrates consistent growth throughout the fiscal year:
| Quarter | Ad Revenue | Annual Contribution Share |
| Q1 2025 | $8.93 Billion | 22.1% |
| Q2 2025 | $9.80 Billion | 24.3% |
| Q3 2025 | $10.26 Billion | 25.4% |
| Q4 2025 | $11.38 Billion | 28.2% |
The fourth quarter represented 28.2% of total annual ad revenue, making it the highest-performing single quarter in YouTube’s history.
YouTube Premium and Subscription Revenue 2026
While advertising continues to drive the majority of volume, non-advertising streams are growing rapidly. YouTube’s subscription segment includes YouTube Premium, YouTube Music Premium, YouTube TV, and Google One bundled services.
YouTube Subscriber Base Expansion
YouTube reported reaching over 325 million paid subscribers across its premium services ecosystem. This growth reflects higher adoption rates for ad-free video viewing, offline playback, background audio listening, and live TV streaming alternatives.
| Service Tier | Estimated Active Subscribers | Monthly Price (US) | Target Audience |
| YouTube Premium (Individual) | ~110 Million | $13.99 / mo | Ad-free core viewers, offline users |
| YouTube Music Premium | ~30 Million | $10.99 / mo | Standalone music streaming listeners |
| YouTube TV | ~8.5 Million | $72.99 / mo | US cord-cutters replacement service |
| Bundled/Family/Student Tiers | ~176.5 Million | Varies | Households and multi-user accounts |
Subscription Financial Contribution
In 2025, non-ad subscription services generated approximately $19.64 billion. Subscription revenue now accounts for nearly 32.7% of YouTube’s total annual revenue, up from under 15% five years ago. This shift provides Alphabet with a reliable, recurring consumer revenue stream that offsets seasonal fluctuations in the advertising market.
YouTube In-App Purchase (IAP) Revenue by Country
Beyond ads and recurring platform subscriptions, YouTube earns substantial margins through direct creator monetization features. These features include Channel Memberships, Super Chats, Super Stickers, Super Thanks, and integrated Merchandise Stores.
YouTube takes an average platform fee split of 30% on direct fan funding transactions, while creators receive the remaining 70%.
YouTube’s Top Global Markets by Mobile In-App Spend
Mobile in-app purchase data indicates strong consumer spending, concentrated heavily in high-ARPU (Average Revenue Per User) regions. The United States dominates overall spending, while Japan and South Korea stand out for fan funding intensity on live streams relative to their total user counts.
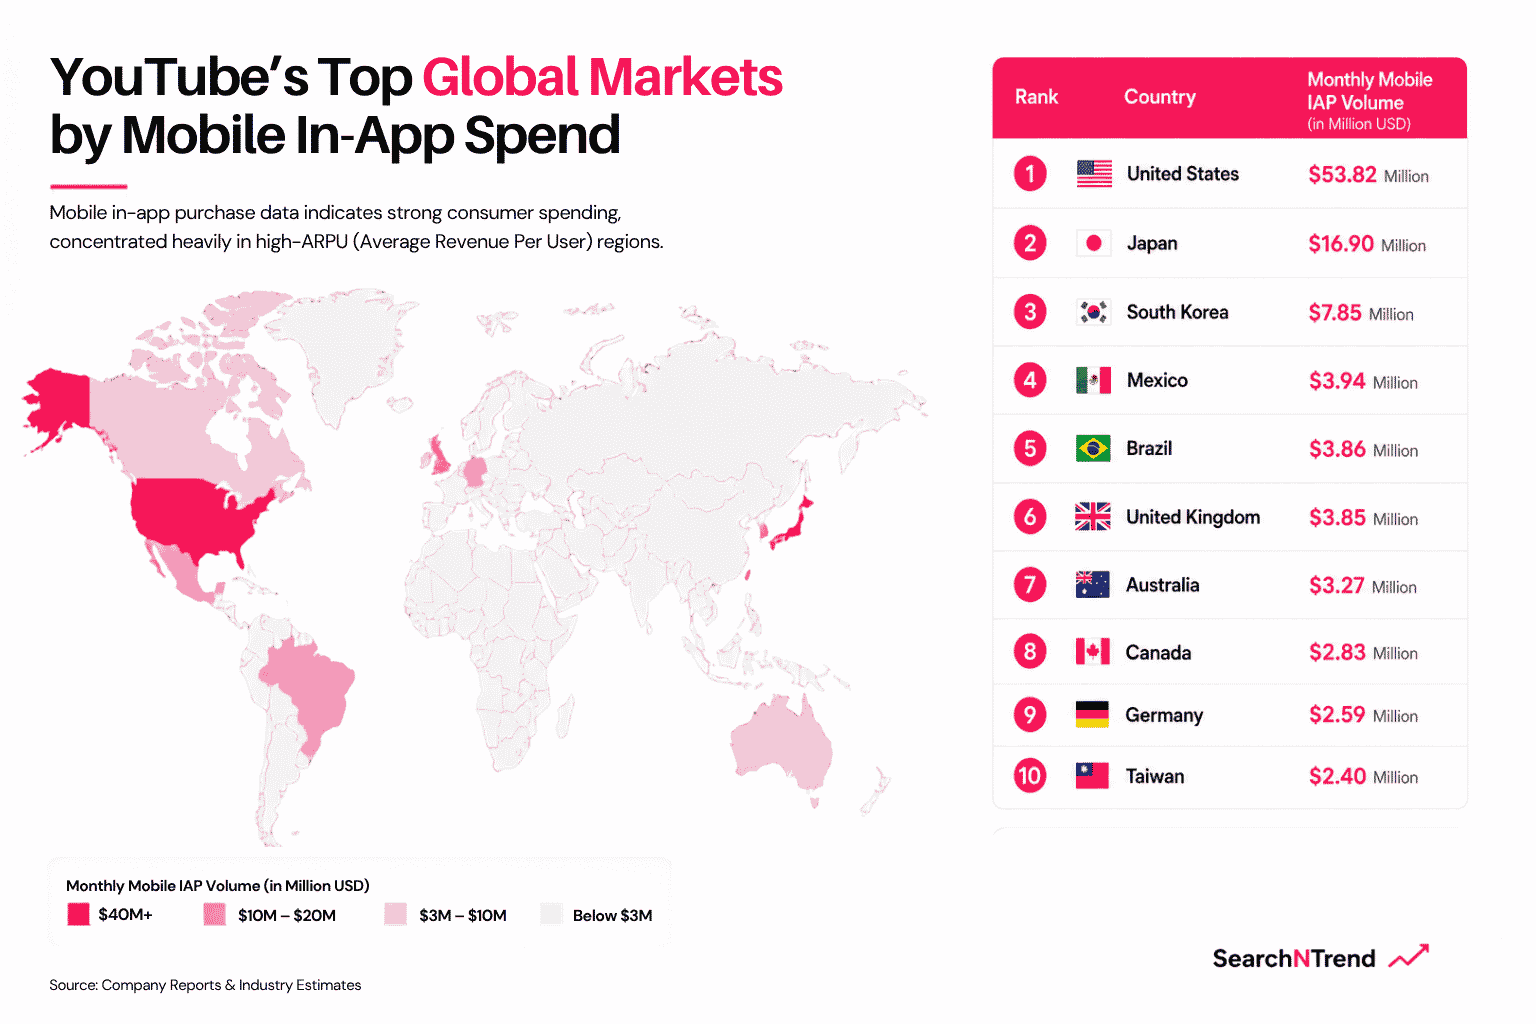
The table below outlines mobile IAP expenditure across leading regional markets:
| Global Rank | Country | Monthly Mobile IAP Volume | Dominant Fan-Funding Feature |
| 1 | United States | $53.82 Million | Channel Memberships & Super Thanks |
| 2 | Japan | $16.90 Million | Super Chats (VTubers & Gaming) |
| 3 | South Korea | $7.85 Million | Live Stream Super Chats & Memberships |
| 4 | Mexico | $3.94 Million | Live Stream Fan Gifting |
| 5 | Brazil | $3.86 Million | Super Chats & Channel Tiers |
| 6 | United Kingdom | $3.85 Million | Memberships & Store Items |
| 7 | Australia | $3.27 Million | Channel Memberships |
| 8 | Canada | $2.83 Million | Super Chats & Memberships |
| 9 | Germany | $2.59 Million | Premium Channel Badges |
| 10 | Taiwan | $2.40 Million | Live Stream Gifting |
YouTube’s Financial Contribution to Alphabet (Google)
YouTube plays an important strategic role in Alphabet’s overall financial portfolio. It acts as both a growth engine and a core platform for brand advertising spend.
Share of Alphabet Total Ad Revenues
Alphabet generated over $400 billion in total consolidated revenue in 2025. YouTube’s $40.36 billion ad revenue contribution accounts for roughly 15% of Alphabet’s total revenues and over 18% of its total Google Services advertising revenues.
| Financial Metric | Metric Value | YouTube Context |
| YouTube Ad Revenue (2025) | $40.36 Billion | Primary standalone video ad channel |
| YouTube Total Revenue (2025) | $60.00 Billion | Includes subscription revenue streams |
| Share of Google Services Ad Sales | ~18.2% | Second only to Google Search |
| Share of Alphabet Consolidated Revenue | ~14.8% | Major growth driver for parent company |
| Standalone Valuation Estimate | $550.00 Billion | ~30% of Alphabet’s total market cap |
Wall Street research estimates indicate that if YouTube were spun off as a standalone publicly traded entity, its market capitalization would reach approximately $550 billion. This valuation makes YouTube more valuable than Netflix, Disney, and traditional media networks.
YouTube Creator Economy & Payout Statistics
YouTube operates one of the world’s largest content payout systems through the YouTube Partner Program (YPP). Over 110 million content creators publish videos on the platform, uploading over 500 hours of video content every minute.
Revenue Sharing Model Split
The platform uses distinct revenue-sharing ratios based on the content format:
- Standard Long-Form Video: Creator receives 55%, YouTube retains 45%.
- YouTube Shorts: Creator receives 45% from the allocated Creator Pool, YouTube retains 55%.
- Fan Funding (Super Chats/Memberships): Creator receives 70%, YouTube retains 30% (after applicable app store fees).
YouTube Average RPM & CPM Earnings by Channel Views
A channel’s actual earnings depend heavily on its Effective RPM (Revenue Per Mille, or earnings per 1,000 views). RPM varies based on target niche, viewer demographic location, video length, and advertiser demand.
| Monthly Channel Views | Average Monthly Revenue Range | Estimated Annual Income Range | Typical Niche Examples |
| 1,000 | $1.00 to $30.00 | $12.00 to $360.00 | Vlog, Personal, Gaming |
| 10,000 | $10.00 to $300.00 | $120.00 to $3,600.00 | Vlogs, Entertainment, Music |
| 100,000 | $100.00 to $3,000.00 | $1,200.00 to $36,000.00 | Tech, Education, Lifestyle |
| 1,000,000 | $1,000.00 to $30,000.00 | $12,000.00 to $360,000.00 | Finance, SaaS, Real Estate |
| 10,000,000 | $10,000.00 to $300,000.00 | $120,000.00 to $3.60 Million | High-production Viral Entertainment |
Niches like personal finance, real estate, technology, and software reviews consistently yield the highest RPM rates ($10.00 to $30.00+ per 1,000 views). In contrast, broader comedy, music, and gaming channels typically average lower RPM rates ($1.00 to $4.00 per 1,000 views).
Top-Earning YouTube Creators 2026
Independent creators have turned channels into global business franchises. Estimated earnings for top creators reflect revenue from AdSense, brand integrations, direct merchandise, and business ventures built off their platform reach.
| Creator Rank | Channel Name | Estimated Annual Revenue | Primary Content Category |
| 1 | MrBeast | $54 Million | Stunts, Challenges, Philanthropy |
| 2 | Jake Paul | $45 Million | Sports, Vlogging, Boxing |
| 3 | Markiplier | $38 Million | Gaming, Horror, Commentary |
| 4 | Good Mythical Morning | $30 Million | Talk Show, Entertainment |
| 5 | Like Nastya | $28 Million | Kids Content, Family Entertainment |
| 6 | Ryan Kaji (Ryan’s World) | $27 Million | Kids Toys, Family Vlogs |
| 7 | Ninja | $20 Million | Esports, Gaming Streams |
| 8 | Dude Perfect | $20 Million | Trick Shots, Sports Comedy |
| 9 | Logan Paul | $18 Million | Podcasts, Boxing, Entertainment |
| 10 | Preston Arsement | $16 Million | Gaming, Minecraft, Vlogging |
YouTube Economic Impact & GDP Contribution
YouTube plays a significant role in job creation and global GDP expansion. By allowing creators, small business owners, and digital publishers to monetize content, the platform contributes directly to national creative economies.
US GDP & Employment Impact of YouTube
According to independent economic impact reports, YouTube’s creative ecosystem contributed substantial economic value to the United States market:
| Metric Year | Contribution to US GDP | Full-Time Equivalent Jobs Supported |
| 2024 | $35.0 Billion | 395,000 Jobs |
| 2025 | $55.0 Billion | 490,000 Jobs |
Key Economic Drivers
- Direct Creator Compensation: Platform ad splits, shorts pool payments, and creator grants.
- Third-Party Ecosystem Jobs: Video editors, graphic designers, producers, talent managers, and channel managers hired directly by creators.
- Small Business Sales: Local businesses leveraging YouTube video marketing to gain external customer sales.
- Music Industry Royalties: Over $6 billion paid annually to music industry rights holders through record label agreements and copyright royalties.
YouTube Future Outlook & Revenue Projections (2026-2030)
YouTube is positioned for sustained revenue growth over the remainder of the decade. Alphabet management has outlined significant capital expenditures (CapEx) targeting between $175 billion and $185 billion in 2026, directed heavily toward AI computing infrastructure, data centers, and advanced monetization systems.
Key Growth Trends
- AI-Powered Ad Placement: Alphabet’s Gemini AI integration allows real-time automated ad creative adjustments, targeting users based on viewing intent to improve advertiser ROI and overall platform CPMs.
- Living Room Screen Conquest: YouTube continues to lead connected TV (CTV) watch time in the United States, outpacing streaming competitors like Netflix and Hulu in total TV screen viewing share.
- YouTube Shorts Monetization Scale: As short-form vertical video ad insertion technology improves, revenue per thousand Shorts views is projected to narrow the gap with traditional long-form content.
- Expanding Paid Subscription Bundles: YouTube continues to expand its sports streaming rights portfolio (such as NFL Sunday Ticket), driving adoption for high-ARPU live TV subscriptions.
Wall Street estimates suggest that YouTube’s total annual revenue across advertising and subscription tiers will approach $85 billion to $90 billion annually by 2030, solidifying its status as a leading global video platform.
References
-
Business of Apps — YouTube Revenue and Usage Statistics
https://www.businessofapps.com/data/youtube-statistics/ -
Alphabet Inc. — Q4 2025 Earnings Release (Official Financial Report)
https://s206.q4cdn.com/479360582/files/doc_financials/2025/q4/2025q4-alphabet-earnings-release.pdf -
Variety — YouTube Music & Premium Subscribers Report
https://variety.com/2025/digital/news/youtube-125-million-music-premium-subscribers-lite-tier-1236328177/ -
Statista — YouTube Paying Subscribers Worldwide
https://www.statista.com/statistics/1344265/youtube-paying-subscribers/ -
Business Wire — YouTube’s Impact on the US Economy and Culture (2023)
https://www.businesswire.com/news/home/20230516005037/en/New-Study-Estimates-YouTubes-Impact-on-US-Economy-and-Culture